


6/29/25 - Technical Sunday
Technical Analysis of BAC, GDX, META, NKE, Oil, PETS, Silver, TSLA, XLF and XLU.

This week, I’m digging into a diverse lineup:
Stocks: Bank of America (BAC), Meta (META), PetMed (PETS), Nike (NKE), Tesla (TSLA)
ETFs: Utilities Select Sector SPDR Fund (GDX), Financial Select Sector SPDR Fund (XLF), Utilities Select Sector SPDR Fund (XLU)
Commodities: Oil, Silver
Come along as I unpack the forces driving these instruments and show you how these moves could shape your investment strategy!
Want to get the most out of my analysis?
For every instrument, you’ll get two charts packed with insights. The top chart brings you three moving averages—20-day (short-term), 50-day (medium-term), and 200-day (long-term)—so you can spot trends at a glance.
The bottom chart is your toolkit, loaded with four powerful indicators: MACD for trend, RSI for momentum, ATR for volatility, and OBV for volume.
I also highlight key support and resistance levels in our analysis, so you can spot those important price zones where the action really heats up!
Together, they give us a complete picture of what’s really happening in the market.
1. Bank of America (BAC)

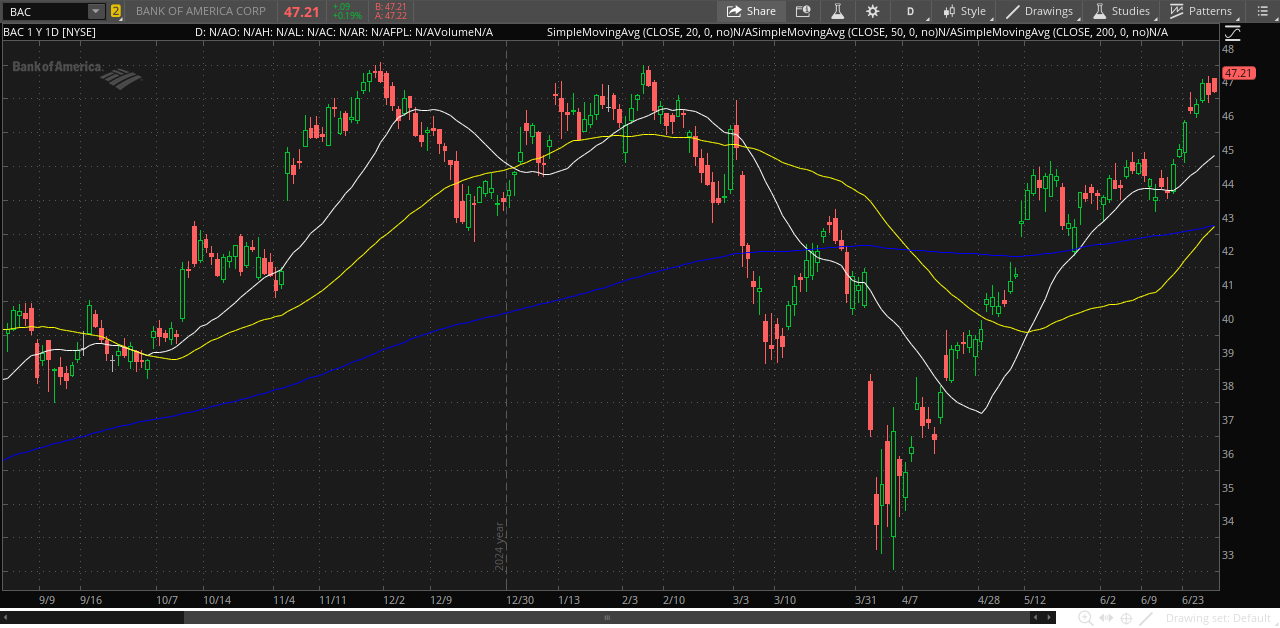

Price: 47.22
Moving Averages
Short-term MA (20-day, white): 45.33
Medium-term MA (50-day, yellow): 43.24
Long-term MA (200-day, blue): 43.25
Short-term (20-day), medium-term (50-day), and long-term (200-day) trends are all bullish (moving average slack)
Trend Indicator
MACD (Moving Average Convergence Divergence): 1.04. Positive momentum.
Momentum Indicator
RSI (Relative Strength Index): 71.82. Overbought territory.
Volatility Indicators
ATR (Average True Range): 0.77. Average volatility (last 14 days, moving, on average, $0.77 per day)
Bollinger Bands: 43.09; 45.33; 47.21. The stock price is slightly above the upper Bollinger Band, indicating possible overbought conditions and a potential for a short-term pullback or consolidation.
Volume Indicator
OBV (On Balance Volume): 261.59 and moving sideways. No strong buying or selling pressure.
Support and Resistance
Support
47.00–47.21 (Immediate Support)
The upper Bollinger Band (47.21), just below the current price, often acts as a short-term resistance-turned-support if the price pulls back after breaking out.
47.00 is a psychological round number and likely to attract buyers on a minor dip.
45.33 (Intermediate Support)
The 20-day moving average and the middle Bollinger Band both sit at $45.33.
This level represents the short-term trend and is a strong technical support if the price pulls back further.
43.09–43.25 (Major Support)
The lower Bollinger Band (43.09), 50-day MA (43.24), and 200-day MA (43.25) cluster together, forming a strong support zone.
If the price falls to this area, it’s likely to find significant buying interest.
Resistance
$47.22 (Immediate Resistance)
The current price is just above the upper Bollinger Band (47.21), which typically acts as resistance.
If the price sustains above this level, it could signal a breakout.
Next Resistance: New Highs
Since the price is at or just above the upper band, any new upward movement would be into uncharted territory (new highs).
Look for psychological resistance at round numbers such as 48.00 or 50.00.
Bottom Line
The stock is in a strong uptrend, trading above all key moving averages, with positive momentum confirmed by MACD. However, with the price now slightly above the upper Bollinger Band and RSI deep in overbought territory, the risk of a short-term pullback or sideways consolidation is elevated. Immediate support lies at 47.00–47.21 and 45.33, while any sustained move above 47.22 would put the stock into new high territory. Caution is warranted for new entries until overbought conditions ease and volume confirms renewed buying pressure.
2. Meta Platforms (META)

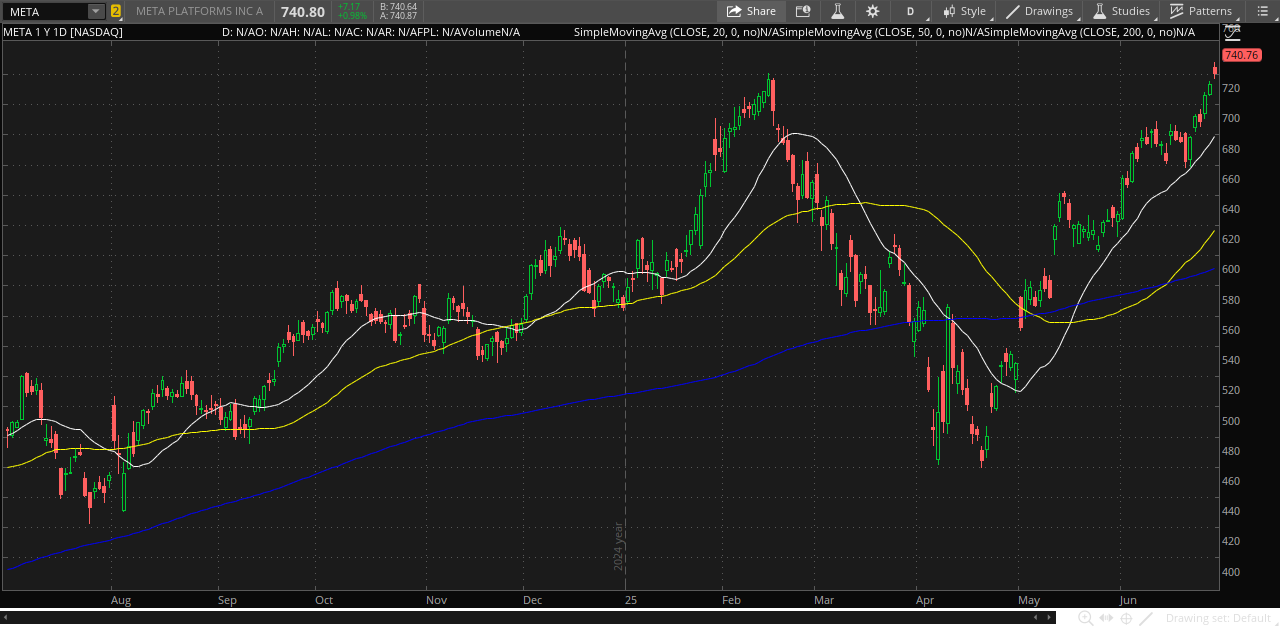

Price: 737.89
Moving Averages
Short-term MA (20-day, white): 698.45
Medium-term MA (50-day, yellow): 636.93
Long-term MA (200-day, blue): 611.40
Strong bullish momentum
Trend Indicator
MACD (Moving Average Convergence Divergence): 23.52. Robust bullish momentum and a strong uptrend.
Momentum Indicator
RSI (Relative Strength Index): 71.05. Overbought territory.
Volatility Indicators
ATR (Average True Range): 15.102. High volatility
Bollinger Bands: 662.07; 698.57; 739.9. The stock is trading near its upper Bollinger Band, signaling possible overbought conditions and an increased chance of a short-term pullback or consolidation. However, if strong momentum continues, the price may remain elevated near the band.
Volume Indicator
OBV (On Balance Volume): 309.51 and rising. Buying pressure is increasing.
Support and Resistance
Support
Short-Term Support: 698.45–698.57
20-day Moving Average: 698.45
Middle Bollinger Band: 698.57
This zone is the nearest technical support. If the price pulls back, buyers may step in here.
Intermediate Support: 662.07
Lower Bollinger Band: 662.07
This is a significant support level, especially in a high-volatility environment.
Major Support: 636.93–611.40
50-day Moving Average: 636.93
200-day Moving Average: 611.40
These longer-term averages provide strong support if there’s a deeper correction.
Resistance
Immediate Resistance: 739.90
Upper Bollinger Band: 739.90
The current price (737.89) is just below this level, which serves as immediate resistance. If broken, it could trigger further buying.
Next Resistance: Psychological Levels
Round Numbers: 750.00, 760.00, etc.
Since the stock is at or near all-time highs, psychological round numbers often act as resistance in uncharted territory.
Bottom Line
The stock is exhibiting robust bullish momentum, trading well above all major moving averages and supported by strong volume inflows. However, with the price near its upper Bollinger Band and RSI in overbought territory, there is an elevated risk of a short-term pullback or consolidation. Immediate resistance stands at 739.90, with further barriers at psychological round numbers like 750.00. Key support levels are at 698.45–698.57 and 662.07. While the uptrend remains intact, traders should be alert for volatility and consider risk management as the stock approaches new highs.
3. Nike (NKE)


Price: 71.04
Moving Averages
Short-term MA (20-day, white): 62.71
Medium-term MA (50-day, yellow): 60.77
Long-term MA (200-day, blue): 71.04
Strong bullish momentum
Trend Indicator
MACD (Moving Average Convergence Divergence): 0.488
Momentum Indicator
RSI (Relative Strength Index): 70.62
Volatility Indicators
ATR (Average True Range): 2.36
Bollinger Bands: 56.38; 62.71; 71.04
Volume Indicator
OBV (On Balance Volume): 54.89 and declining.
Support and Resistance
Support
Major Support: 71.04
The current price is exactly at the 200-day moving average and the upper Bollinger Band, both at 71.04. This convergence creates a strong technical support zone. If the price pulls back, buyers may step in here.
Intermediate Support: 62.71
The 20-day moving average and the middle Bollinger Band are both at 62.71. This is the next significant support level below the current price, marking the short-term trend floor.
Longer-Term Support : 60.77
The 50-day moving average at 60.77 provides additional support if the price declines further.
Major Support: 56.38
The lower Bollinger Band at 56.38 represents a significant support zone in case of a deeper pullback.
Resistance
Immediate Resistance: 71.04
Since the price is at the upper Bollinger Band and the 200-day MA, this level also acts as immediate resistance. If the price breaks above this, it would signal a potential breakout into new highs.
Next Resistance: New Highs
If $71.04 is surpassed, the stock would be in uncharted territory. Psychological round numbers such as 72.00, 75.00, and 80.00 may act as resistance due to trader behavior
Bottom Line
The stock is exhibiting strong bullish momentum, trading at a key inflection point where the price, upper Bollinger Band, and 200-day moving average all converge at 71.04. While this level acts as both immediate support and resistance, overbought signals from RSI and a declining OBV suggest buying momentum may be fading. If the price holds above 71.04, a breakout to new highs is possible, with psychological resistance at 72.00 and beyond. If it fails, expect support at 62.71 and 60.77. Traders should watch for confirmation of direction, as the next move could set the tone for either continuation or reversal.
4. PetMed (PETS)


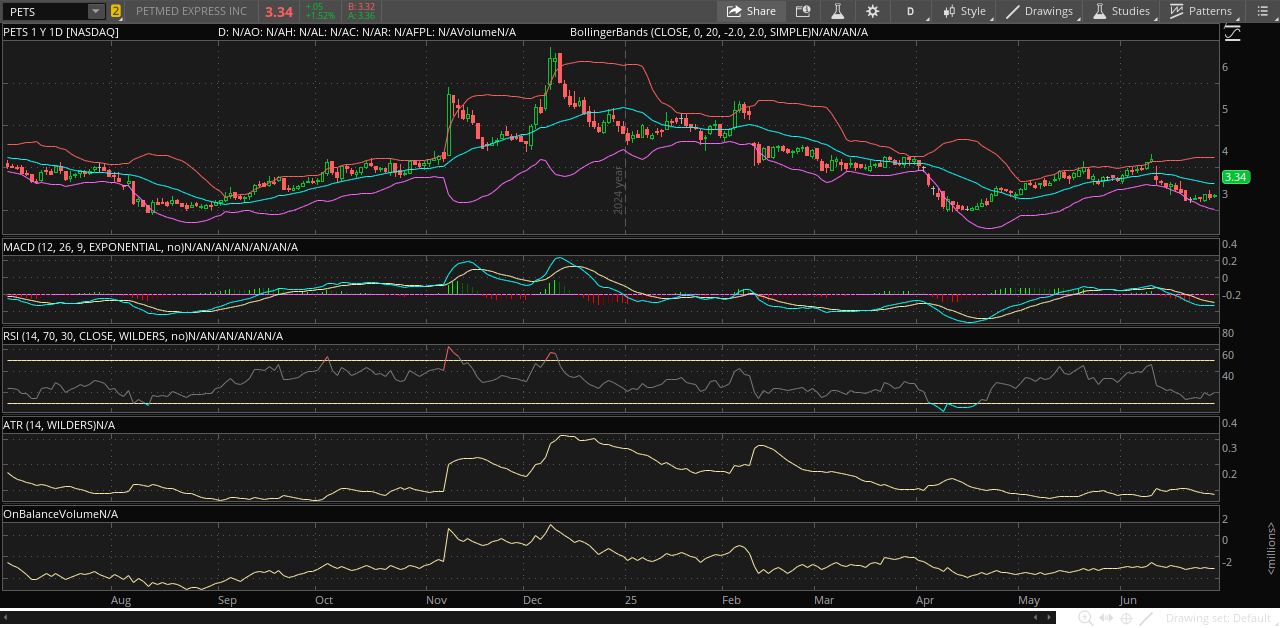
Price: 3.32
Moving Averages
Short-term MA (20-day, white): 3.62
Medium-term MA (50-day, yellow): 3.62
Long-term MA (200-day, blue): 4.22
Trend Indicator
MACD (Moving Average Convergence Divergence): -0.1289
Momentum Indicator
RSI (Relative Strength Index): 39.09
Volatility Indicators
ATR (Average True Range): 0.18.
Bollinger Bands: 3.01; 3.62; 4.24.
Volume Indicator
OBV (On Balance Volume): -1.003 and rising.
Support and Resistance
Support
3.01 (Major Support)
Lower Bollinger Band: 3.01
This is the nearest strong technical support. If the price falls further, buyers may step in at this level.
Psychological Support: 3.00
Round numbers like $3.00 often act as psychological support, especially for lower-priced stocks.
Resistance
3.62 (Immediate Resistance)
20-day and 50-day Moving Averages: Both at 3.62
Middle Bollinger Band: 3.62
This is a strong resistance zone. The price needs to break above this level to signal any short-term recovery.
4.22–4.24 (Major Resistance)
200-day Moving Average: 4.22
Upper Bollinger Band: 4.24
This is the next major resistance area if the price can move above $3.62.
Bottom Line
The stock remains in a bearish trend, trading below all key moving averages and facing immediate resistance at 3.62, where both the 20-day and 50-day moving averages and the middle Bollinger Band converge. Major resistance is higher at 4.22–4.24. Support is found at 3.01 (lower Bollinger Band) and the psychological level of 3.00. While momentum and trend indicators remain weak, a rising OBV suggests some accumulation. The price must reclaim and hold above 3.62 to signal any meaningful reversal; otherwise, the risk of continued downside persists.
5. Tesla (TSLA)


Price: 317.66
Moving Averages
Short-term MA (20-day, white): 323.89
Medium-term MA (50-day, yellow): 312.82
Long-term MA (200-day, blue): 313.28
Trend Indicator
MACD (Moving Average Convergence Divergence): 2.08
Momentum Indicator
RSI (Relative Strength Index): 47.42
Volatility Indicators
ATR (Average True Range): 16.9
Bollinger Bands: 293.88; 323.89; 353.72
Volume Indicator
OBV (On Balance Volume): 2.05 and declining.
Support and Resistance
Support
312.82–313.28 (Near-term Support)
50-day Moving Average: 312.82
200-day Moving Average: 313.28
These two moving averages are closely aligned, creating a strong support zone just below the current price.
293.88 (Major Support)
Lower Bollinger Band: 293.88
If the price drops further, this level provides significant technical support.
Resistance
323.89 (Immediate Resistance)
20-day Moving Average: 323.89
Middle Bollinger Band: 323.89
The price is currently below both, making this a key resistance area.
353.72 (Major Resistance)
Upper Bollinger Band: 353.72
This represents the next major resistance if the price can break above 323.89.
Bottom Line
The stock is currently trading in a consolidation zone, with support at 312.82–313.28 and immediate resistance at 323.89. Momentum indicators are neutral, and declining OBV suggests waning buying interest, while high volatility persists. A decisive move above 323.89 could open the door to further gains toward 353.72, but a drop below the 312.82–313.28 support zone may trigger a deeper correction toward 293.88. Traders should watch for a breakout from this range to confirm the next directional move.
6. VanEck Gold Miners ETF (GDX)


Price: 52.06
Moving Averages
Short-term MA (20-day, white): 52.65
Medium-term MA (50-day, yellow): 50.42
Long-term MA (200-day, blue): 42.59
Trend Indicator
MACD (Moving Average Convergence Divergence): 0.52
Momentum Indicator
RSI (Relative Strength Index): 51.89
Volatility Indicators
ATR (Average True Range): 1.37
Bollinger Bands: 50.83; 52.65; 54.47
Volume Indicator
OBV (On Balance Volume): 270.92 and declining.
Support and Resistance
Support
50.83 (Near-term Support)
Lower Bollinger Band: 50.83
This is the closest technical support below the current price and may attract buyers if the price dips.
50.42 (Intermediate Support)
50-day Moving Average: 50.42
Serves as additional support if the price breaks below the lower Bollinger Band.
42.59 (Major Support)
200-day Moving Average: 42.59
Represents a significant long-term support level in the event of a deeper correction.
Resistance
52.65 (Immediate Resistance)
20-day Moving Average & Middle Bollinger Band: 52.65
The price is just below this level, making it the first resistance to watch for a potential breakout.
54.47 (Major Resistance)
Upper Bollinger Band: 54.47
If the price breaks above 52.65, this is the next key resistance level.
Bottom Line
The ETF is consolidating just below its short-term resistance at 52.65, with neutral momentum and moderate volatility. Support is close by at 50.83 and 50.42, while major resistance sits at 54.47. The declining OBV indicates fading buying interest, so a clear move above 52.65 is needed to spark further upside. Conversely, a drop below 50.42 could lead to a deeper pullback toward the long-term support at 42.59. Until a breakout occurs, expect continued sideways movement within this range.
7. Financial Select Sector SPDR Fund (XLF)


Price: 52.37
Moving Averages
Short-term MA (20-day, white): 51.0
Medium-term MA (50-day, yellow): 50.16
Long-term MA (200-day, blue): 49.02
Trend Indicator
MACD (Moving Average Convergence Divergence): 0.42
Momentum Indicator
RSI (Relative Strength Index): 66.67
Volatility Indicators
ATR (Average True Range): 0.65
Bollinger Bands: 49.81; 51.0; 52.19
Volume Indicator
OBV (On Balance Volume): 521.36 and rising.
Support and Resistance
Support
50.83 (Near-term Support)
This is the lower Bollinger Band and the closest technical support below the current price. It may attract buyers if the price dips.
50.42 (Intermediate Support)
The 50-day moving average, providing additional support if the price breaks below the lower Bollinger Band.
42.59 (Major Support)
The 200-day moving average, representing a significant long-term support level in the event of a deeper correction.
Resistance
52.65 (Immediate Resistance)
The 20-day moving average and the middle Bollinger Band are both at 52.65. This is the first resistance to watch for a potential breakout.
54.47 (Major Resistance)
The upper Bollinger Band at 54.47 is the next key resistance if the price breaks above 52.65.
Bottom Line
The ETF is showing strong bullish momentum, trading above all key moving averages with rising volume (OBV). It is currently near resistance at 52.19 (upper Bollinger Band), just above the price of 52.37. Immediate support lies around 51.00 (20-day MA and middle Bollinger Band) and 50.16 (50-day MA). A decisive break above 52.19 could pave the way for further gains, while a pullback may find buyers near the support zone. Moderate volatility (ATR 0.65) suggests manageable price swings as the stock tests these critical levels.
8. Utilities Select Sector SPDR Fund (XLU)


Price: 81.66
Moving Averages
Short-term MA (20-day, white): 78.73
Medium-term MA (50-day, yellow): 77.92
Long-term MA (200-day, blue): 75.89
Trend Indicator
MACD (Moving Average Convergence Divergence): 0.19
Momentum Indicator
RSI (Relative Strength Index): 55.16
Volatility Indicators
ATR (Average True Range): 1.05
Bollinger Bands: 80.1; 81.18; 82.25
Volume Indicator
OBV (On Balance Volume): 178.3 and rising.
Support and Resistance
Support
81.18 (Near-term Support)
Middle Bollinger Band: 81.18
This is the closest technical support just below the current price, likely to attract buyers if there is a pullback.
80.10 (Secondary Support)
Lower Bollinger Band: 80.10
Provides additional support if the price dips below 81.18.
78.73 (Intermediate Support)
20-day Moving Average: 78.73
Serves as a further support level, marking the short-term trend floor.
77.92 / 75.89 (Major Support)
50-day Moving Average: 77.92
200-day Moving Average: 75.89
These longer-term averages offer strong support in case of a deeper correction.
Resistance Levels
82.25 (Immediate Resistance)
Upper Bollinger Band: 82.25
This is the first resistance level above the current price and may act as a ceiling in the short term.
Above 82.25 (New Highs)
If the price breaks above 82.25, watch for psychological resistance at round numbers such as 83.00 or 85.00, as traders often place orders at these levels.
Bottom Line
The ETF is maintaining a bullish posture above all major moving averages, supported by rising volume and steady momentum. Immediate resistance is at 82.25, with the price currently just below this level. Near-term support sits at 81.18, followed by 80.10 and the 20-day moving average at 78.73. With moderate volatility and a positive trend, a breakout above 82.25 could lead to new highs, while any pullback is likely to find buying interest at the outlined support zones
9. Oil, Sweet Crude Oil Futures Aug 25

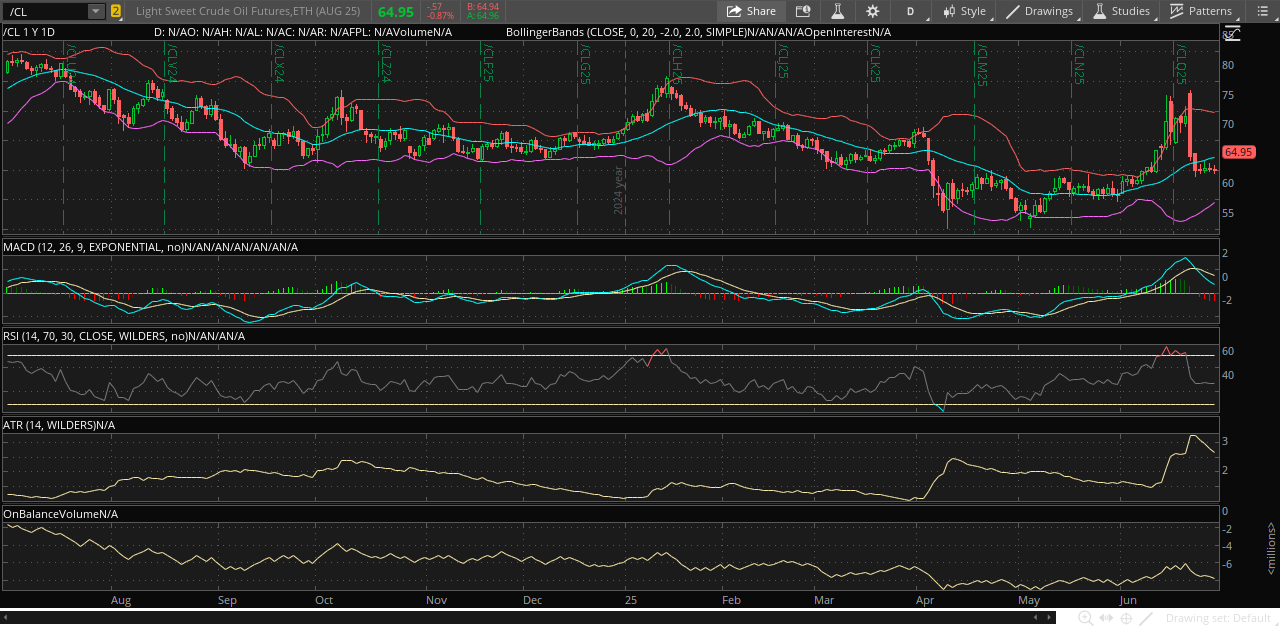
Price: 64.97
Moving Averages
Short-term MA (20-day, white): 69.84
Medium-term MA (50-day, yellow): 72.25
Long-term MA (200-day, blue): 73.47
Trend Indicator
MACD (Moving Average Convergence Divergence): 0.73
Momentum Indicator
RSI (Relative Strength Index): 46.84
Volatility Indicators
ATR (Average True Range): 3.17
Bollinger Bands: 59.52; 67.12; 74.72
Volume Indicator
OBV (On Balance Volume): -5.76 and moving sideways.
Support and Resistance
Support
59.52 (Immediate Support)
Lower Bollinger Band: 59.52
This is the closest technical support below the current price and may attract buyers if the price declines further.
Round Number Support: 60.00
Psychological Level: 60.00
Round numbers often act as psychological support zones for traders.
Resistance
67.12 (Immediate Resistance)
Middle Bollinger Band: 67.12
The price is currently below this level, making it the first resistance to watch for a potential reversal or breakout.
69.84 (Short-term Resistance)
20-day Moving Average: 69.84
This moving average acts as dynamic resistance in the short term.
72.25 (Medium-term Resistance)
50-day Moving Average: 72.25
A key resistance level if the price manages to recover further.
73.47 (Long-term Resistance)
200-day Moving Average: 73.47
Represents a significant ceiling in the longer term.
74.72 (Major Resistance)
Upper Bollinger Band: 74.72
This is the highest technical resistance in the current range.
Bottom Line
The stock is currently in a bearish to neutral phase, trading below all major moving averages and key resistance levels. Immediate resistance stands at 67.12, with additional barriers at 69.84, 72.25, and 73.47, while support is found at 59.52 and the psychological level of 60.00. Momentum and volume indicators are weak, and volatility remains elevated. Unless the price can break above 67.12, the risk of further downside persists, with buyers likely to emerge near the 60.00–59.52 support zone. Traders should watch for a decisive move outside this range to confirm the next trend direction.
10. Silver, Silver Futures Sep 25

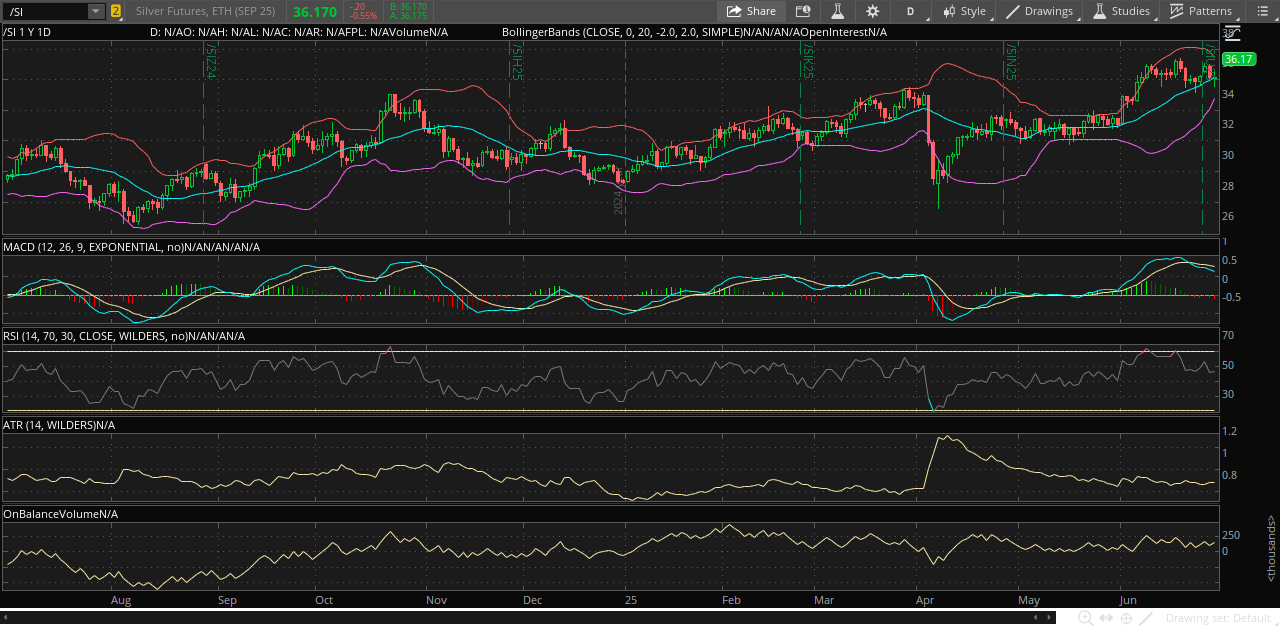
Price: 36.33
Moving Averages
Short-term MA (20-day, white): 36.13
Medium-term MA (50-day, yellow): 34.23
Long-term MA (200-day, blue): 32.54
Trend Indicator
MACD (Moving Average Convergence Divergence): 0.65
Momentum Indicator
RSI (Relative Strength Index): 57.55
Volatility Indicators
ATR (Average True Range): 0.88
Bollinger Bands: 34.777; 36.133; 37.489
Volume Indicator
OBV (On Balance Volume): 401.096 and moving sideways.
Support and Resistance
Support
36.13 (Near-term Support)
20-day Moving Average & Middle Bollinger Band: 36.13
This is the closest technical support, just below the current price, and may attract buyers if the price dips.
34.77 (Secondary Support)
Lower Bollinger Band: 34.77
Provides additional support if the price moves below 36.13.
34.23 (Intermediate Support)
50-day Moving Average: 34.23
Marks a further support level, representing the medium-term trend.
32.54 (Major Support)
200-day Moving Average: 32.54
A significant long-term support level in the event of a deeper correction.
Resistance
37.49 (Immediate Resistance)
Upper Bollinger Band: 37.49
This is the first resistance level above the current price and may act as a ceiling in the short term.
Psychological Resistance: 38.00
Round Number: 38.00
Traders often watch round numbers as psychological resistance.
Bottom Line
The stock is in a moderately bullish position, trading just above its 20-day moving average and middle Bollinger Band at 36.13, with positive momentum confirmed by a healthy MACD and RSI. Immediate resistance stands at 37.49, with a psychological barrier at 38.00, while support is close by at 36.13 and further down at 34.77 and 34.23. With volatility moderate and OBV moving sideways, a breakout above 37.49 could trigger further gains, while a drop below 36.13 may lead to a retest of lower support levels. Traders should watch for a decisive move outside this range to confirm the next trend direction.

This content is for educational purposes only and should not be taken as financial advice. Always do your own research before making investment decisions.